
This report is available only on the Fitune Ultra plan.
How does this report help you?
- See at a glance the overall totals and averages for your classes (schedules, bookings, attendances, no-shows, cancellations).
- Compare which classes have the best or worst booking, attendance, occupancy, or no-show rates.
- Identify which days and times are most popular for your classes.
- Analyze detailed performance broken down by class, trainer, or location.
- Filter all of the above by class, class type, staff, location, location type, and date range.
Available Visualizations
-
Summary
Shows totals (schedules, bookings, attendances, no-shows, cancellations) and average rates (occupancy, booking, attendance, no-show, cancellation) based on applied filters.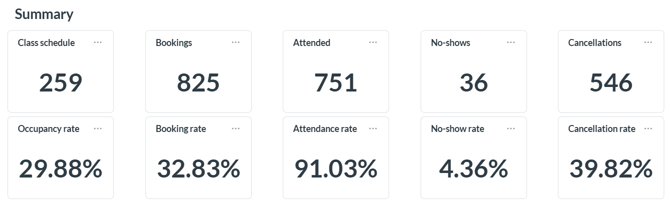
-
Class Rate
Horizontal bar chart comparing up to 10 classes by the selected rate (booking, attendance, occupancy, or no-show). The chart title updates dynamically based on the rate you're viewing.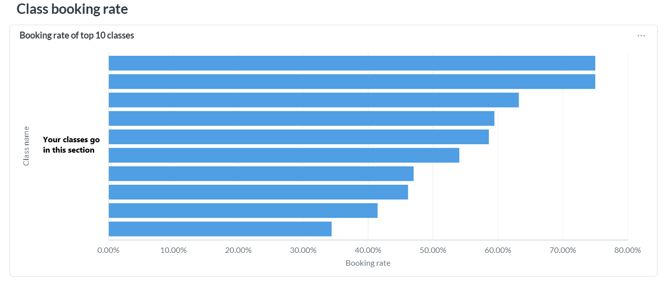
-
Class Popularity
Bar chart showing the average booking rate by day of the week, to help identify your most popular days.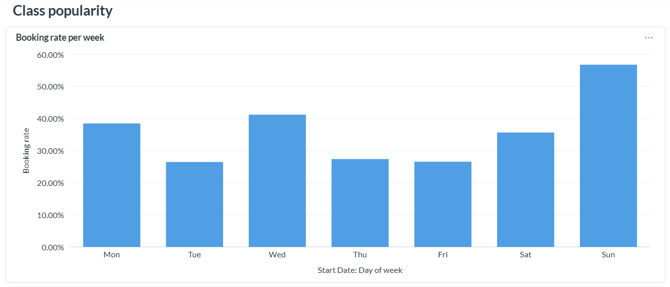
-
Current Booking Rate
Heatmap-style table crossing weekday and start time, showing the booking rate for each combination. The darker the blue, the higher the booking rate.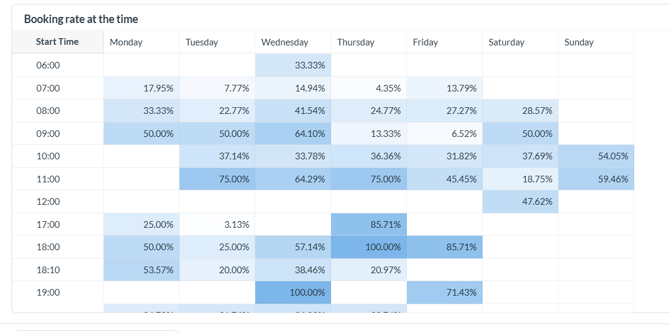
Information Available in the Report
- Class schedules – total number of scheduled sessions.
- Total capacity – maximum available capacity.
- Booked – number of people who booked.
- Attended – number of people who attended.
- Cancelled – number of people who cancelled.
- No-shows – number of people who didn't attend without cancelling.
- Waitlisted – number of people on the waiting list.
- Occupancy rate – percentage of capacity used.
- Booking rate – percentage of capacity booked.
- Attendance rate – percentage of bookings that attended.
- No-show rate – percentage of bookings that didn't attend.
- Cancellation rate – percentage of bookings that were cancelled.
Detailed Analysis Views
- By Class: groups first by class, expandable to see the trainer-level breakdown.
- By Trainer: groups first by trainer, expandable to see the class-level breakdown.
- By Location: groups first by location, expandable to see the class-level breakdown.
Note: if a class has no assigned trainer, it will display as "No trainer".
Frequently Asked Questions
▶ Why don't I see this report in my account? This report is only available for accounts on the Fitune Ultra plan.
▶ How many classes show up in the "Class Rate" chart? Up to a maximum of 10. If you have fewer than 10 classes, all of them will be shown.
▶ Do the insights and charts change if I apply filters? Yes. The entire report updates automatically based on the filters you apply (class, class type, staff, location, location type, or date range).
▶ What does the "Popularity by Time" heatmap mean? Each cell represents the booking rate for a specific day-and-time combination. The darker the blue, the higher the booking rate for that time slot. Blank cells mean there's no data for that combination.
▶ What's the default date range shown? The last 30 days, including today, though you can change it anytime.
▶ What's the difference between this report and "Class Attendance"? "Class Attendance" focuses on overall occupancy trends over time. "Class Performance" lets you compare and break down specific performance by class, trainer, and location.